
The Geometry of
Modern Markets.
Navigating global financial flows requires more than just data. It demands a sophisticated visual framework. We provide the technical education and charting expertise necessary to interpret market movements across Australia, Japan, and South Korea.
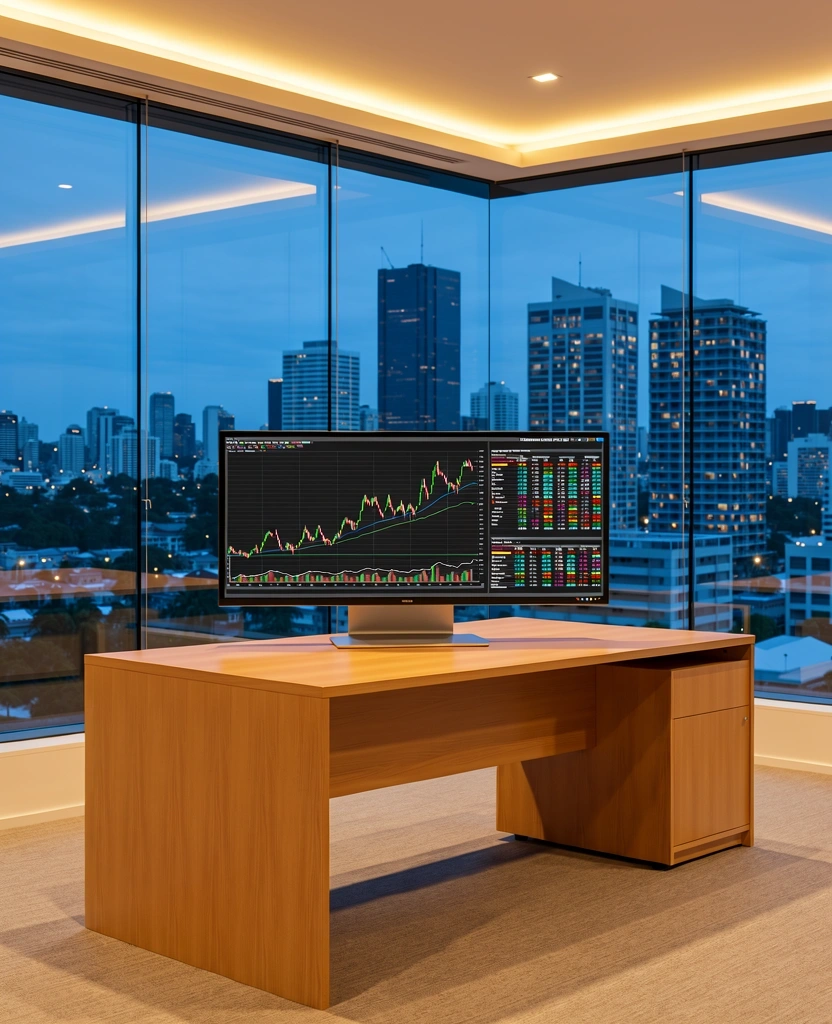
Chart Mastery as a
Professional Core.
In the professional trading ecosystems of Tokyo and Seoul, the ability to rapidly iterate on technical hypotheses is a differentiator. Our programs focus heavily on the **TradingView** ecosystem, teaching users how to build custom indicator sets, manage multi-timeframe layouts, and automate alert logic.
- Custom Pine Script Development
- ASX and Nikkei 225 Correlation Mapping
- Volume Profile and Order Flow Analysis
Technical Literacy
Beyond simple support and resistance. We break down complex algorithmic market structures and how to visualize them effectively for day trading and swing positions.


Cross-Border Analysis
Strategies for navigating the specific liquidity profiles of the Australian Securities Exchange (ASX) versus the volatile tech-heavy KOSPI and Japan’s complex bond market relationships.
Localized Market Insights.
Financial analysis is not a universal language; it is a series of regional dialects. Solvef Digital bridges the gap between Western technical methodologies and Eastern market behaviors.
Australia (ASX)
Focus on resource-heavy cycles, commodity currency correlations (AUD/USD), and yield-driven equity analysis. We teach the software configurations needed to track iron ore and gold impact on domestic listings in real-time.
Custom Sector Heatmaps & Dividend Yield Scanners
Japan (TSE)
Understanding the "Carry Trade" and the Bank of Japan's influence on the Nikkei 225. Analysis focuses on Ichimoku Kinko Hyo mastery and advanced candlestick patterns originated in the Japanese rice markets.
Multi-Timeframe Ichimoku Clouds & JPY FX Crosses
South Korea (KRX)
Analyzing high-beta technology sectors and retail-driven momentum. Our curriculum covers the rapid volatility typical of the KOSPI and the importance of monitoring offshore institutional flows via automated scripts.
Momentum Oscillators & Institutional Flow Tracking
Data Without Noise.
"The goal of formal financial analysis is not to predict the future, but to create a repeatable process for identifying high-probability windows."
— Solvef Digital AdvisoryStructured Interpretation.
01. Filtration
Eliminate redundant indicators. We teach you how to strip the chart down to price action and essential volume metrics to reduce cognitive load during market hours.
02. Contextualization
Aligning technical setups with the macroeconomic calendar. Learn how to use TradingView's integrated economic event overlays to avoid trading into low-liquidity "news traps."
03. Execution Logic
From analysis to action. We guide you through the bridging of chart analysis and order entry, ensuring your professional risk management remains intact regardless of market volatility.
Deepen Your Analytical Capability
Our consultants are available for specialized institutional training and private education across our Brisbane, Tokyo, and Seoul networks. Contact us to discuss tailored curriculum options for your professional development.
Request ConsultationSession Hours
Monday – Friday
9:00 AM – 6:00 PM EST
(Regional Adjustments Apply)
Latest analysis update: March 2026
Disclaimer & Standards
Financial trading involves significant risk of loss and is not suitable for all individuals. Information provided on this page and through Solvef Digital's educational programs is for instructional purposes only and does not constitute financial advice. Past performance is not indicative of future results. Please refer to our Compliance & Standards for detailed regional regulatory information.